

Giving Claude a Zoom Tool for Reading Fine Image Detail
Introduction
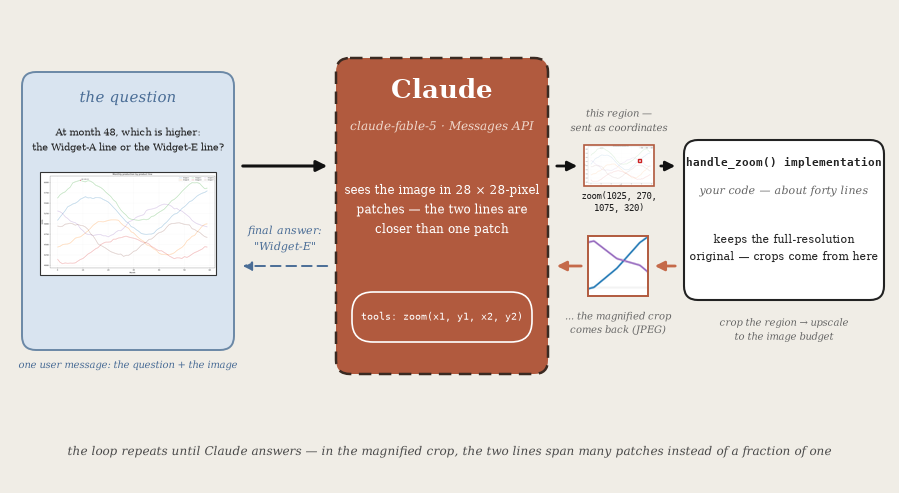
When a detail in an image is too small to make out, you lean in and look closer. Claude can't do that on its own: it sees an image once, at a fixed effective resolution, and when a chart label or a pair of closely spaced lines is too small at that resolution, no amount of prompting recovers it.
The zoom tool gives Claude the lean-in move.
When Claude asks for a closer look at a region, the tool crops that region out of the full-resolution original image and returns it magnified, so the small thing becomes legible. This notebook builds that tool, and on a public chart-reading benchmark it more than doubles accuracy (results below). Why magnification works, in terms of how Claude actually sees images, comes a little later.
By the end of this cookbook, you'll be able to:
- Pre-resize images with the public docs'
resized_size()reference implementation, so the pixel coordinates Claude emits map 1:1 onto the image you hold - Define a self-contained zoom tool — absolute pixel coordinates in, a budget-filling magnified crop out — you can lift into any project
- Run the agentic loop around it, including the stop-reason handling that keeps long, thinking-heavy turns from silently truncating
Charts are this notebook's running example, but the same pattern applies anywhere detail is small relative to the image: dense documents, UI screenshots, schematics, scanned forms, photos of labels.
The Results, Up Front
An example problem
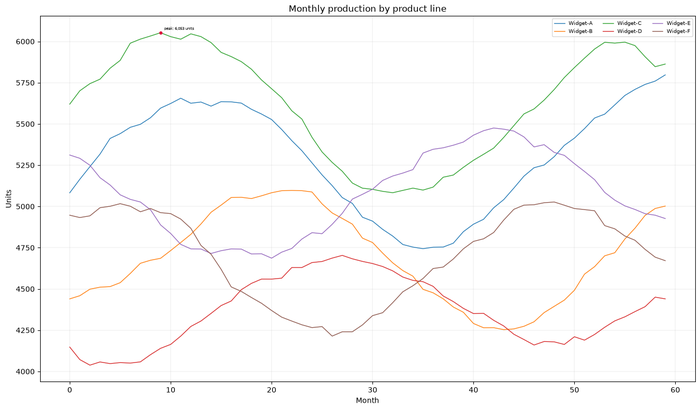
At month 48, which product line has the higher value: Widget-A or Widget-E? At that month the two lines sit about 26 units apart — roughly 8 pixels in this rendering — right next to a genuine crossing. (This is a demonstration problem this notebook generates for itself, in the style of the dense real-world charts the benchmark below uses; the benchmark's own questions are a held-out evaluation set and are not reproduced here.)
With and without the tool
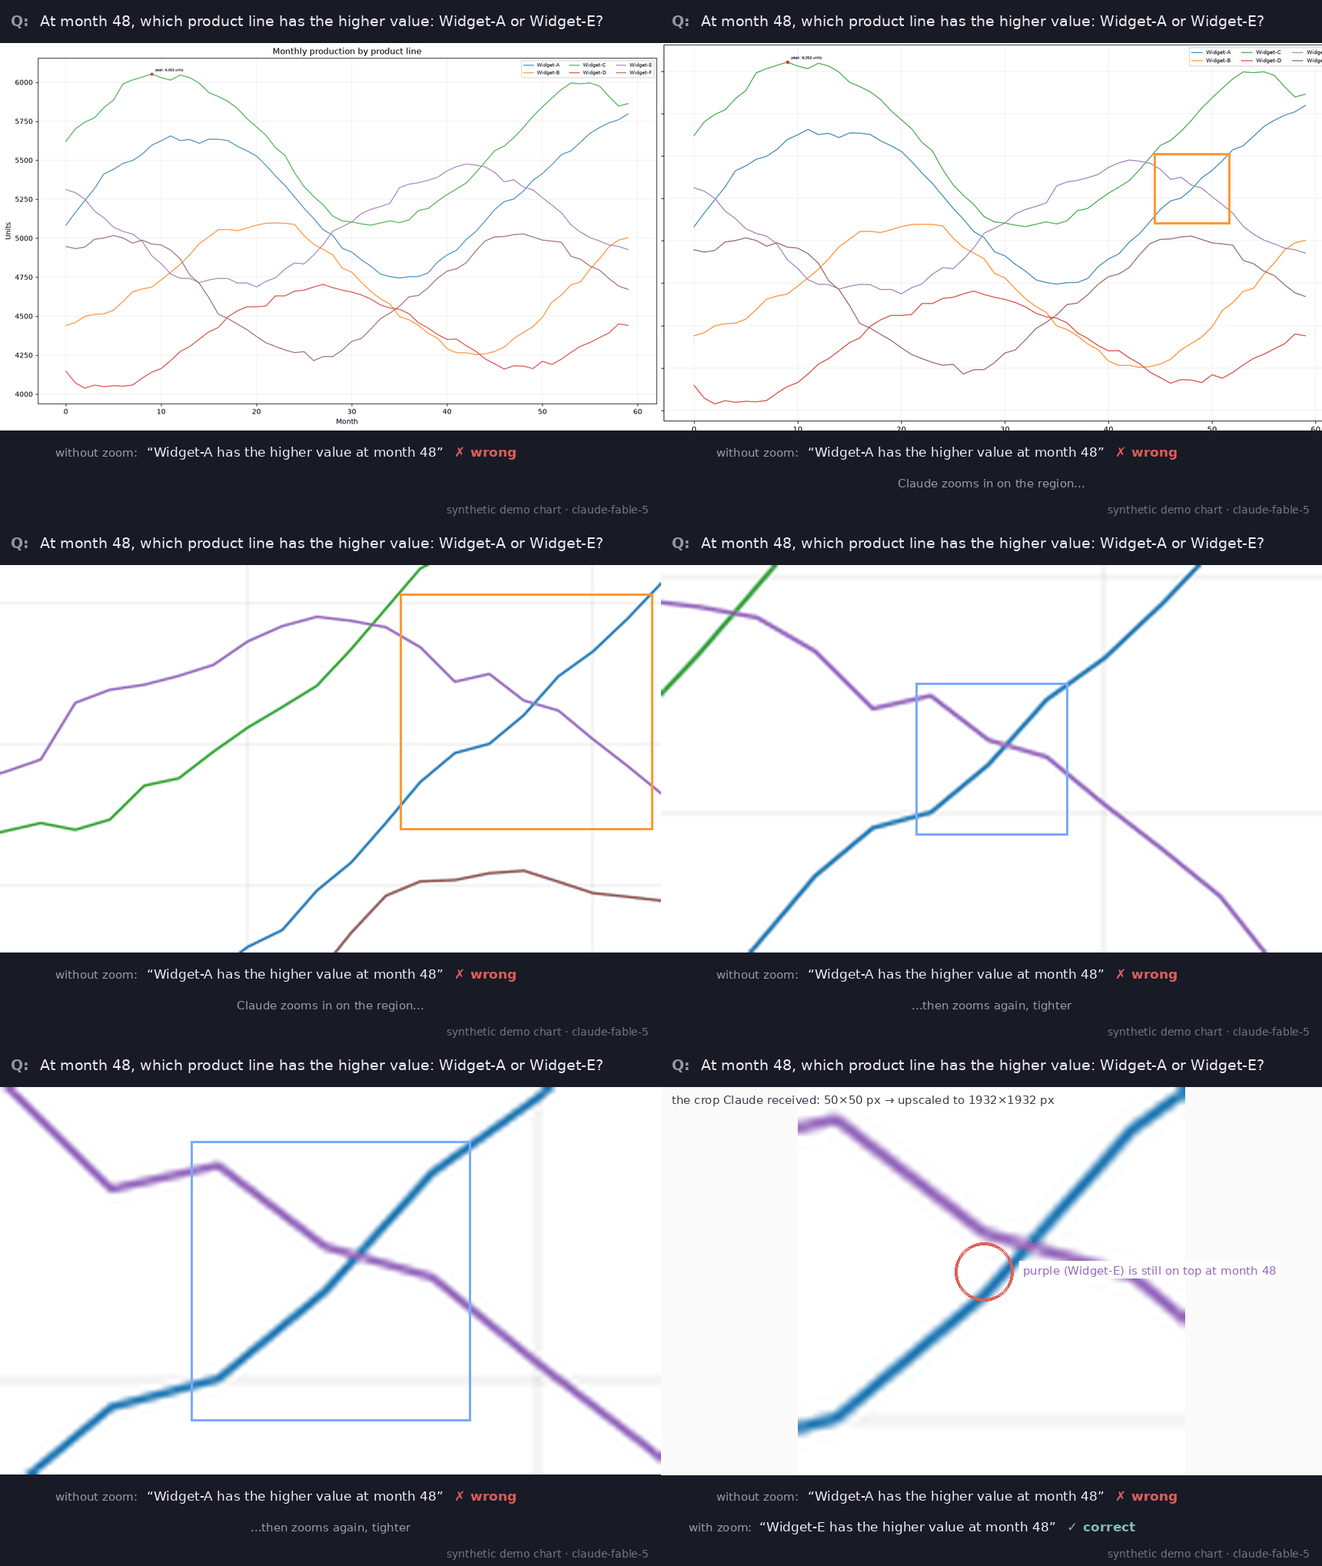
Asked cold, the model answers Widget-A — confidently, usually narrating the nearby crossing as if it had already happened — and it is wrong in 36 of 40 recorded attempts (90%). Given the zoom tool, it zooms in on the crossing repeatedly, each crop tighter than the last, reads the ordering from the magnified view, and answers Widget-E — correctly, in 40 of 40 recorded attempts (100%) with exactly the code this notebook builds. (Those are repeated runs of this one demonstration problem; the benchmark numbers below are a separate, single-pass measurement.) You will run exactly this exchange yourself later in the notebook.
The numbers
The same pattern, measured on Chartography(opens in new tab) — a public benchmark from Surge AI of 100 chart-reading questions over dense, real-world charts — by asking every question twice per model (with and without the tool) and grading free-form answers with a model judge per the dataset card. Each bar below is one model in one condition — accuracy over all 100 questions — and the arrows mark what adding the tool changes; mean per-question costs are in the figure note. The tool buys its accuracy with extra tokens: each zoom call re-sends the conversation plus a magnified crop.
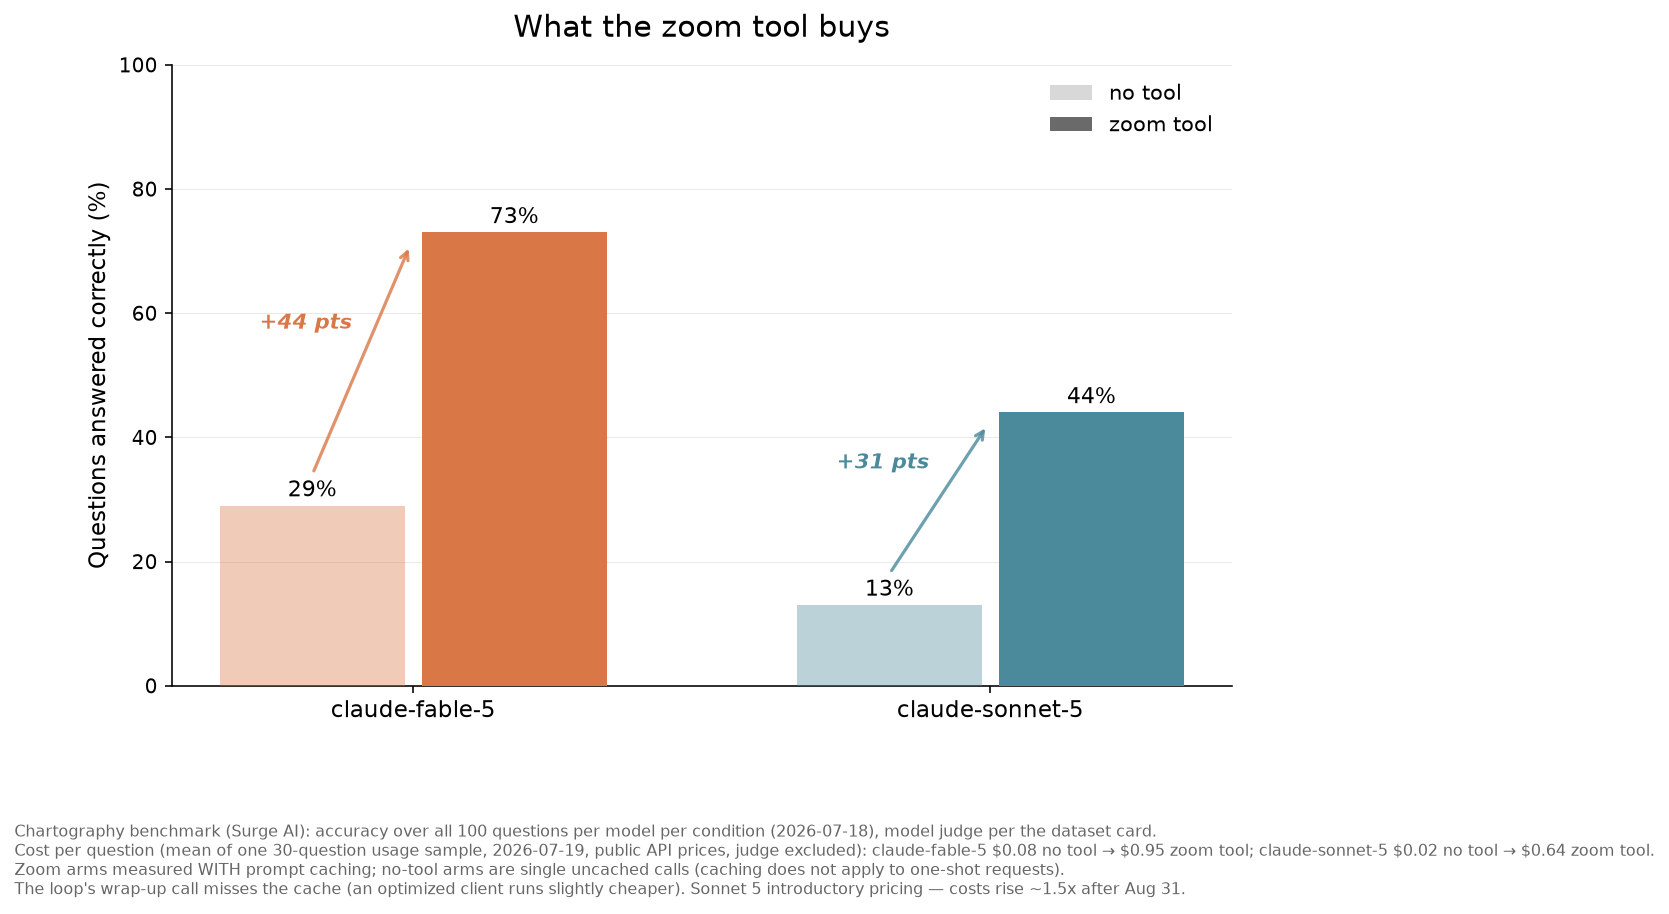
These numbers come from running the benchmark against the public Claude API with the models named on the chart: accuracy over all 100 questions per model per condition (2026-07-18), and cost as the mean of a 30-question usage sample (2026-07-19) at public API prices (Sonnet 5 at its introductory price), judge excluded. The zoom arms were measured with prompt caching and the no-tool arms as single uncached calls, since caching does not apply to one-shot requests; the loop's wrap-up call misses the cache, so an optimized client runs slightly cheaper.
Note: Chartography is a held-out evaluation set — don't use it for training (the dataset card(opens in new tab) ships a canary string for exactly that purpose). Prompts, golden answers, and metadata are © Surge AI, CC BY 4.0. Chart images sourced from the web remain the property of their original rights holders; this cookbook redistributes nothing from the dataset.
Prerequisites
Required Knowledge:
- Python fundamentals
- Basic familiarity with tool use(opens in new tab) in the Messages API
Required Tools:
- Python 3.11 or higher
- Anthropic API key (get one here(opens in new tab))
Setup
Note: you may need to restart the kernel to use updated packages.
Create a Demo Chart
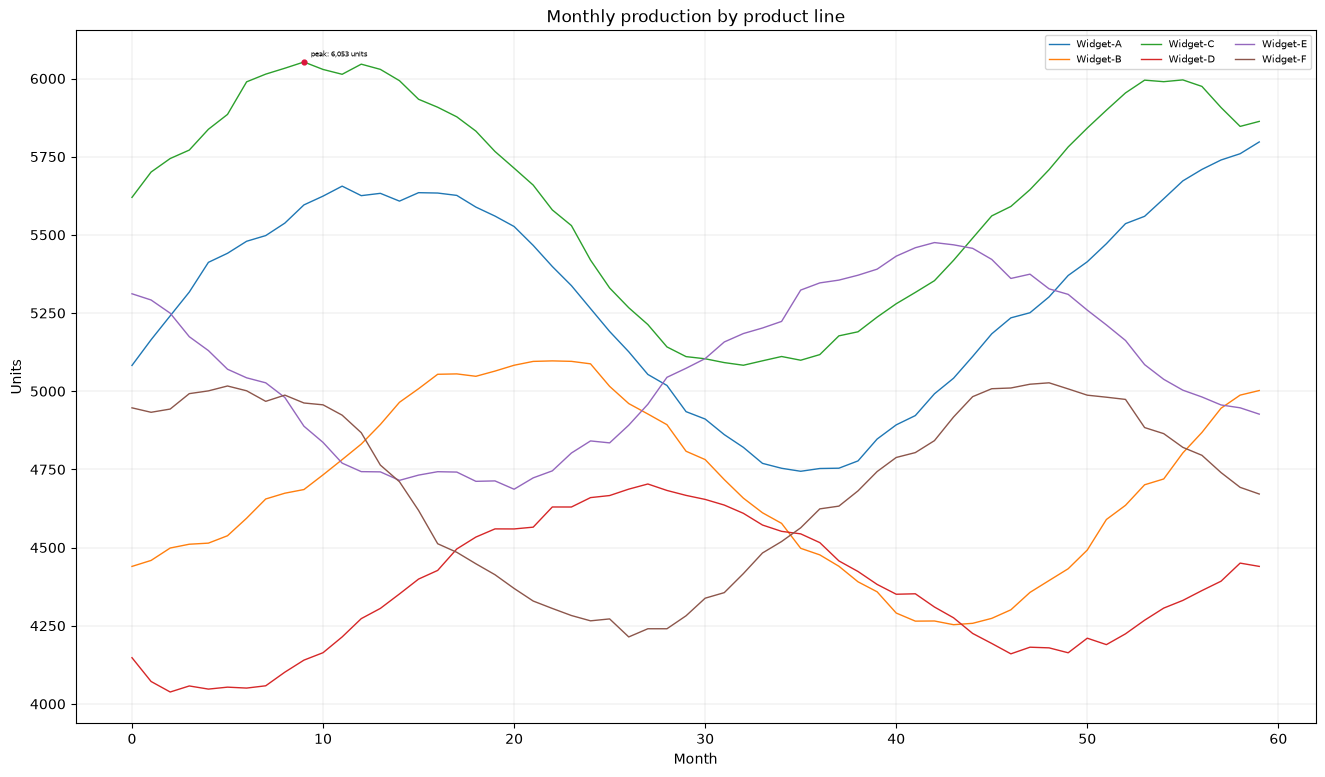
We'll draw the kind of chart the zoom tool exists for: six series, a dense grid, and the answer to our question printed in deliberately tiny type. Generating it ourselves means we know the ground truth exactly — and that the annotation is genuinely too small to read in the full view.
Chart size: (1325, 777)
Question: What exact value is annotated at the peak of the Widget-C line?
How Claude Sees Images — and Why Pixel Coordinates
Two facts about how Claude processes images(opens in new tab) shape the design of the tool:
-
Images are measured in visual tokens. An image costs one visual token per 28×28-pixel patch, and each model has an image budget: on the standard resolution tier, no side may exceed 1568 pixels and an image may cost at most 1568 visual tokens; high-resolution-tier models (such as
claude-fable-5andclaude-sonnet-5) allow 2576 pixels and 4784 visual tokens. Images over the limits are automatically scaled down before Claude sees them — and small details scale down with them. -
Claude works best with absolute pixel coordinates. The vision coordinates guide(opens in new tab) recommends asking for pixel coordinates explicitly, and recommends against normalized (0–1) coordinates. One catch: the coordinates Claude uses are pixel positions in the image Claude saw — after any automatic downscaling. The fix is to resize the image yourself before uploading, so the image you hold is exactly the image Claude sees, and every coordinate maps 1:1.
The coordinates guide provides a reference implementation, resized_size(), that computes the exact size Claude resizes an image to. We copy it below and use it twice:
- Before uploading: resize the image we show Claude, so that the zoom coordinates it sends us map 1:1 onto the image we have.
- When zooming: scale the cropped region up to the largest size within the budget, so every element in it gets as many patches as possible.
Define the Zoom Tool
The flow for each zoom call:
- Claude requests a region as pixel coordinates
(x1, y1)–(x2, y2), with the origin(0, 0)at the top-left corner (x increases to the right, y increases downward). - We map those coordinates onto the full-resolution original (which may be larger than the copy Claude saw) and crop the region from it.
- We scale the crop up to the largest size the image budget allows and return it.
Cropping from the original rather than from the downscaled copy means the zoom works with every pixel the source image has.
One practical detail: zoomed crops are returned as JPEG rather than PNG. Tool results accumulate in the conversation, and a few full-budget PNG crops of a detailed chart can exceed the API's 32 MB request size limit(opens in new tab). (For conversations that accumulate many large images, the Files API(opens in new tab) keeps request payloads small regardless of history length.)
The next cell is self-contained — schema and implementation, no other cells needed — so you can copy it directly into your own project.
Let's test the zoom tool manually before handing it to Claude — zooming into the upper region of the chart where the peak annotation sits:
Original size: (1325, 777), size Claude sees: (1325, 777)
Zoomed into (0,0)-(1325,233) of the image you see at 1325x777px: a 1325x233px region of the original, returned magnified to 2576x453px.

The Agentic Loop
Now we connect everything: send the image to Claude with the zoom tool available, and let Claude call it until it has an answer. The SDK's tool_runner drives the exchange — it calls our zoom function whenever the model asks, feeds the magnified crop back, and stops when the model answers (or after max_iterations, a guard against runaway loops).
Three details matter here:
- We keep both the full-resolution original (for the tool to crop from) and the pre-resized copy that Claude actually sees (whose size defines the coordinate space). The
zoomfunction closes over both. - The prompt states each image's dimensions and the coordinate convention, so Claude knows exactly which pixel space it is working in.
@beta_toolbuilds the tool's schema from the function's signature and docstring — to add a second tool, decorate another function and add it to thetoolslist; the runner dispatches by name.
One wrinkle: the API can pause a very long turn server-side (stop_reason == "pause_turn"), and the runner does not yet resume these itself — the small loop around it below replays the transcript and continues when that happens.
Demo: Chart Analysis
Let's ask Claude to analyze our chart. Watch how it uses the zoom tool to examine specific regions.
Question: What exact value is annotated at the peak of the Widget-C line?

Claude's analysis:


[Tool] zoom({'x1': 260, 'y1': 35, 'x2': 450, 'y2': 80})

[Assistant] The annotation at the peak of the Widget-C line reads **"peak: 6,053 units"** — so the exact annotated value is **6,053 units**.

Ground truth (we drew it): peak: 6,053 units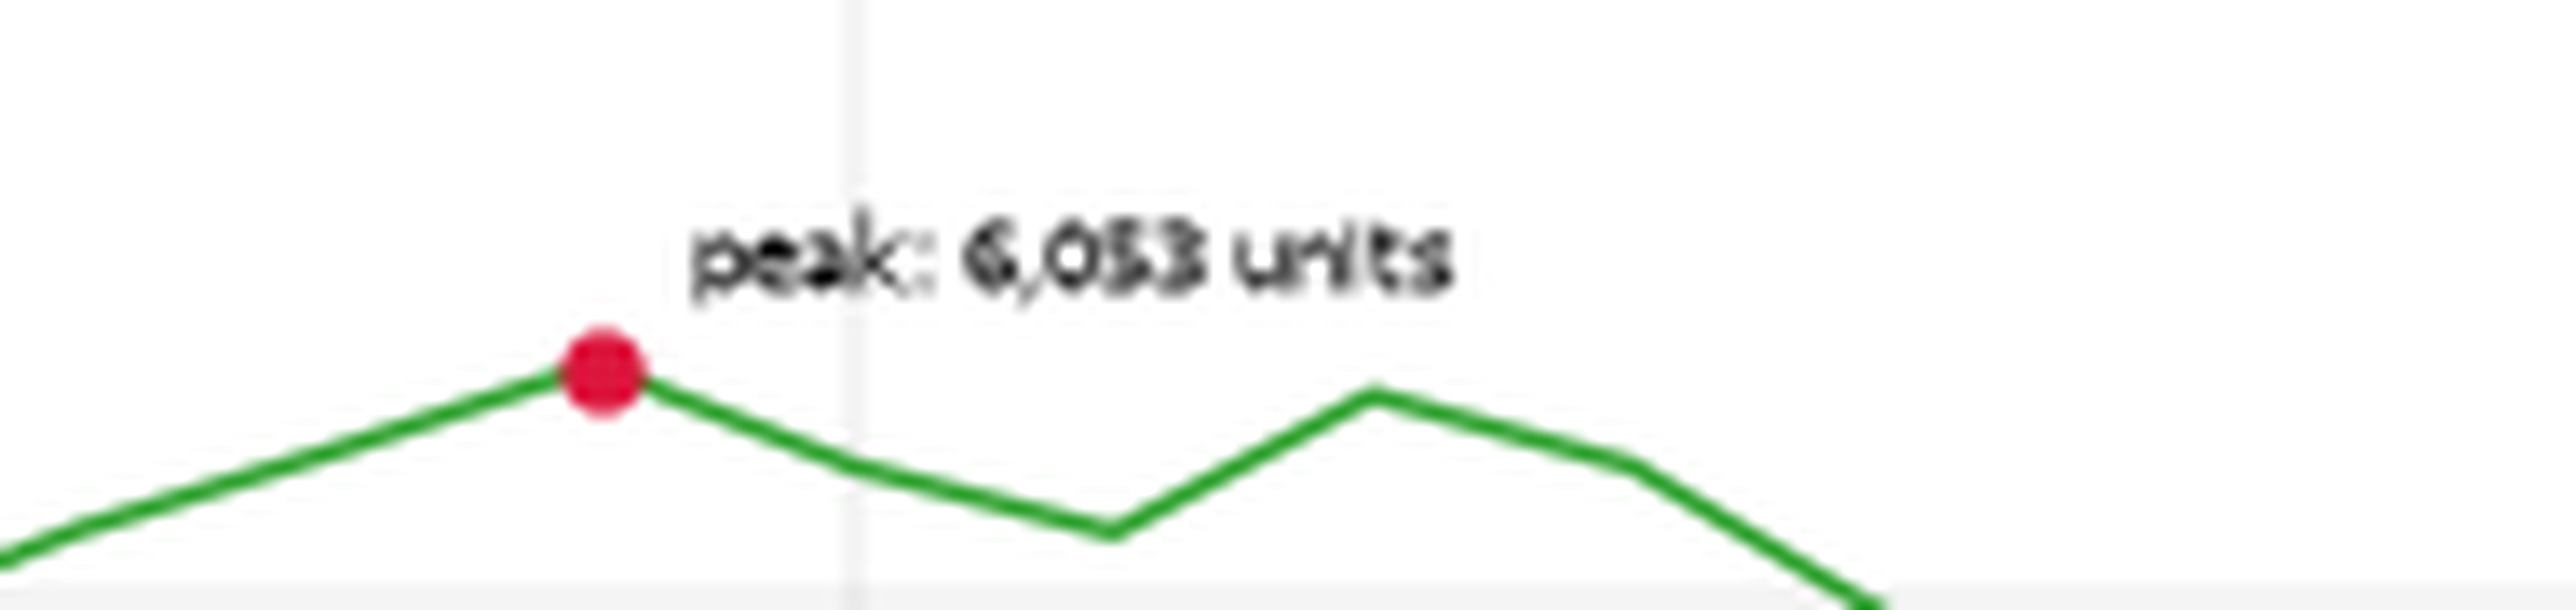
When the Full View Lies
Reading small text is only half the failure mode — the other half is geometry. At month 48 of this same chart, the Widget-A and Widget-E lines sit about 26 units apart: roughly 8 pixels in this rendering, a fraction of one 28×28 patch, with a genuine crossing nearby to confuse matters further. An ordering question at that separation physically cannot be resolved at patch granularity.
Ask without the tool, and Claude confidently picks the wrong line — in 36 of 40 recorded runs. With the zoom tool, it magnifies the crossing region (zooming in repeatedly, each crop tighter than the last) and gets it right — in 40 of 40.
Note: this near-tie contrast is tuned for
claude-fable-5, the strongest chart reader in the benchmark above. Smaller models miss it much more often even with the tool — in our runs,claude-sonnet-5called this crossing correctly only once in 10 attempts with the tool available. The zoom recovers the pixels; calling an almost-touching crossing still takes the model's best visual reasoning.
WITHOUT the tool:
**Widget-A** has the higher value at month 48. The blue Widget-A line is rising steeply at that point (around ~5,350 units), having just crossed above the purple Widget-E line, which is declining (around ~5,300 units). The two lines cross at roughly month 47, so by month 48 Widget-A is slightly above Widget-E.

WITH the zoom tool:

[Tool] zoom({'x1': 980, 'y1': 230, 'x2': 1120, 'y2': 360})

[Tool] zoom({'x1': 1025, 'y1': 270, 'x2': 1075, 'y2': 320})

[Assistant] **Widget-E** has the higher value at month 48.

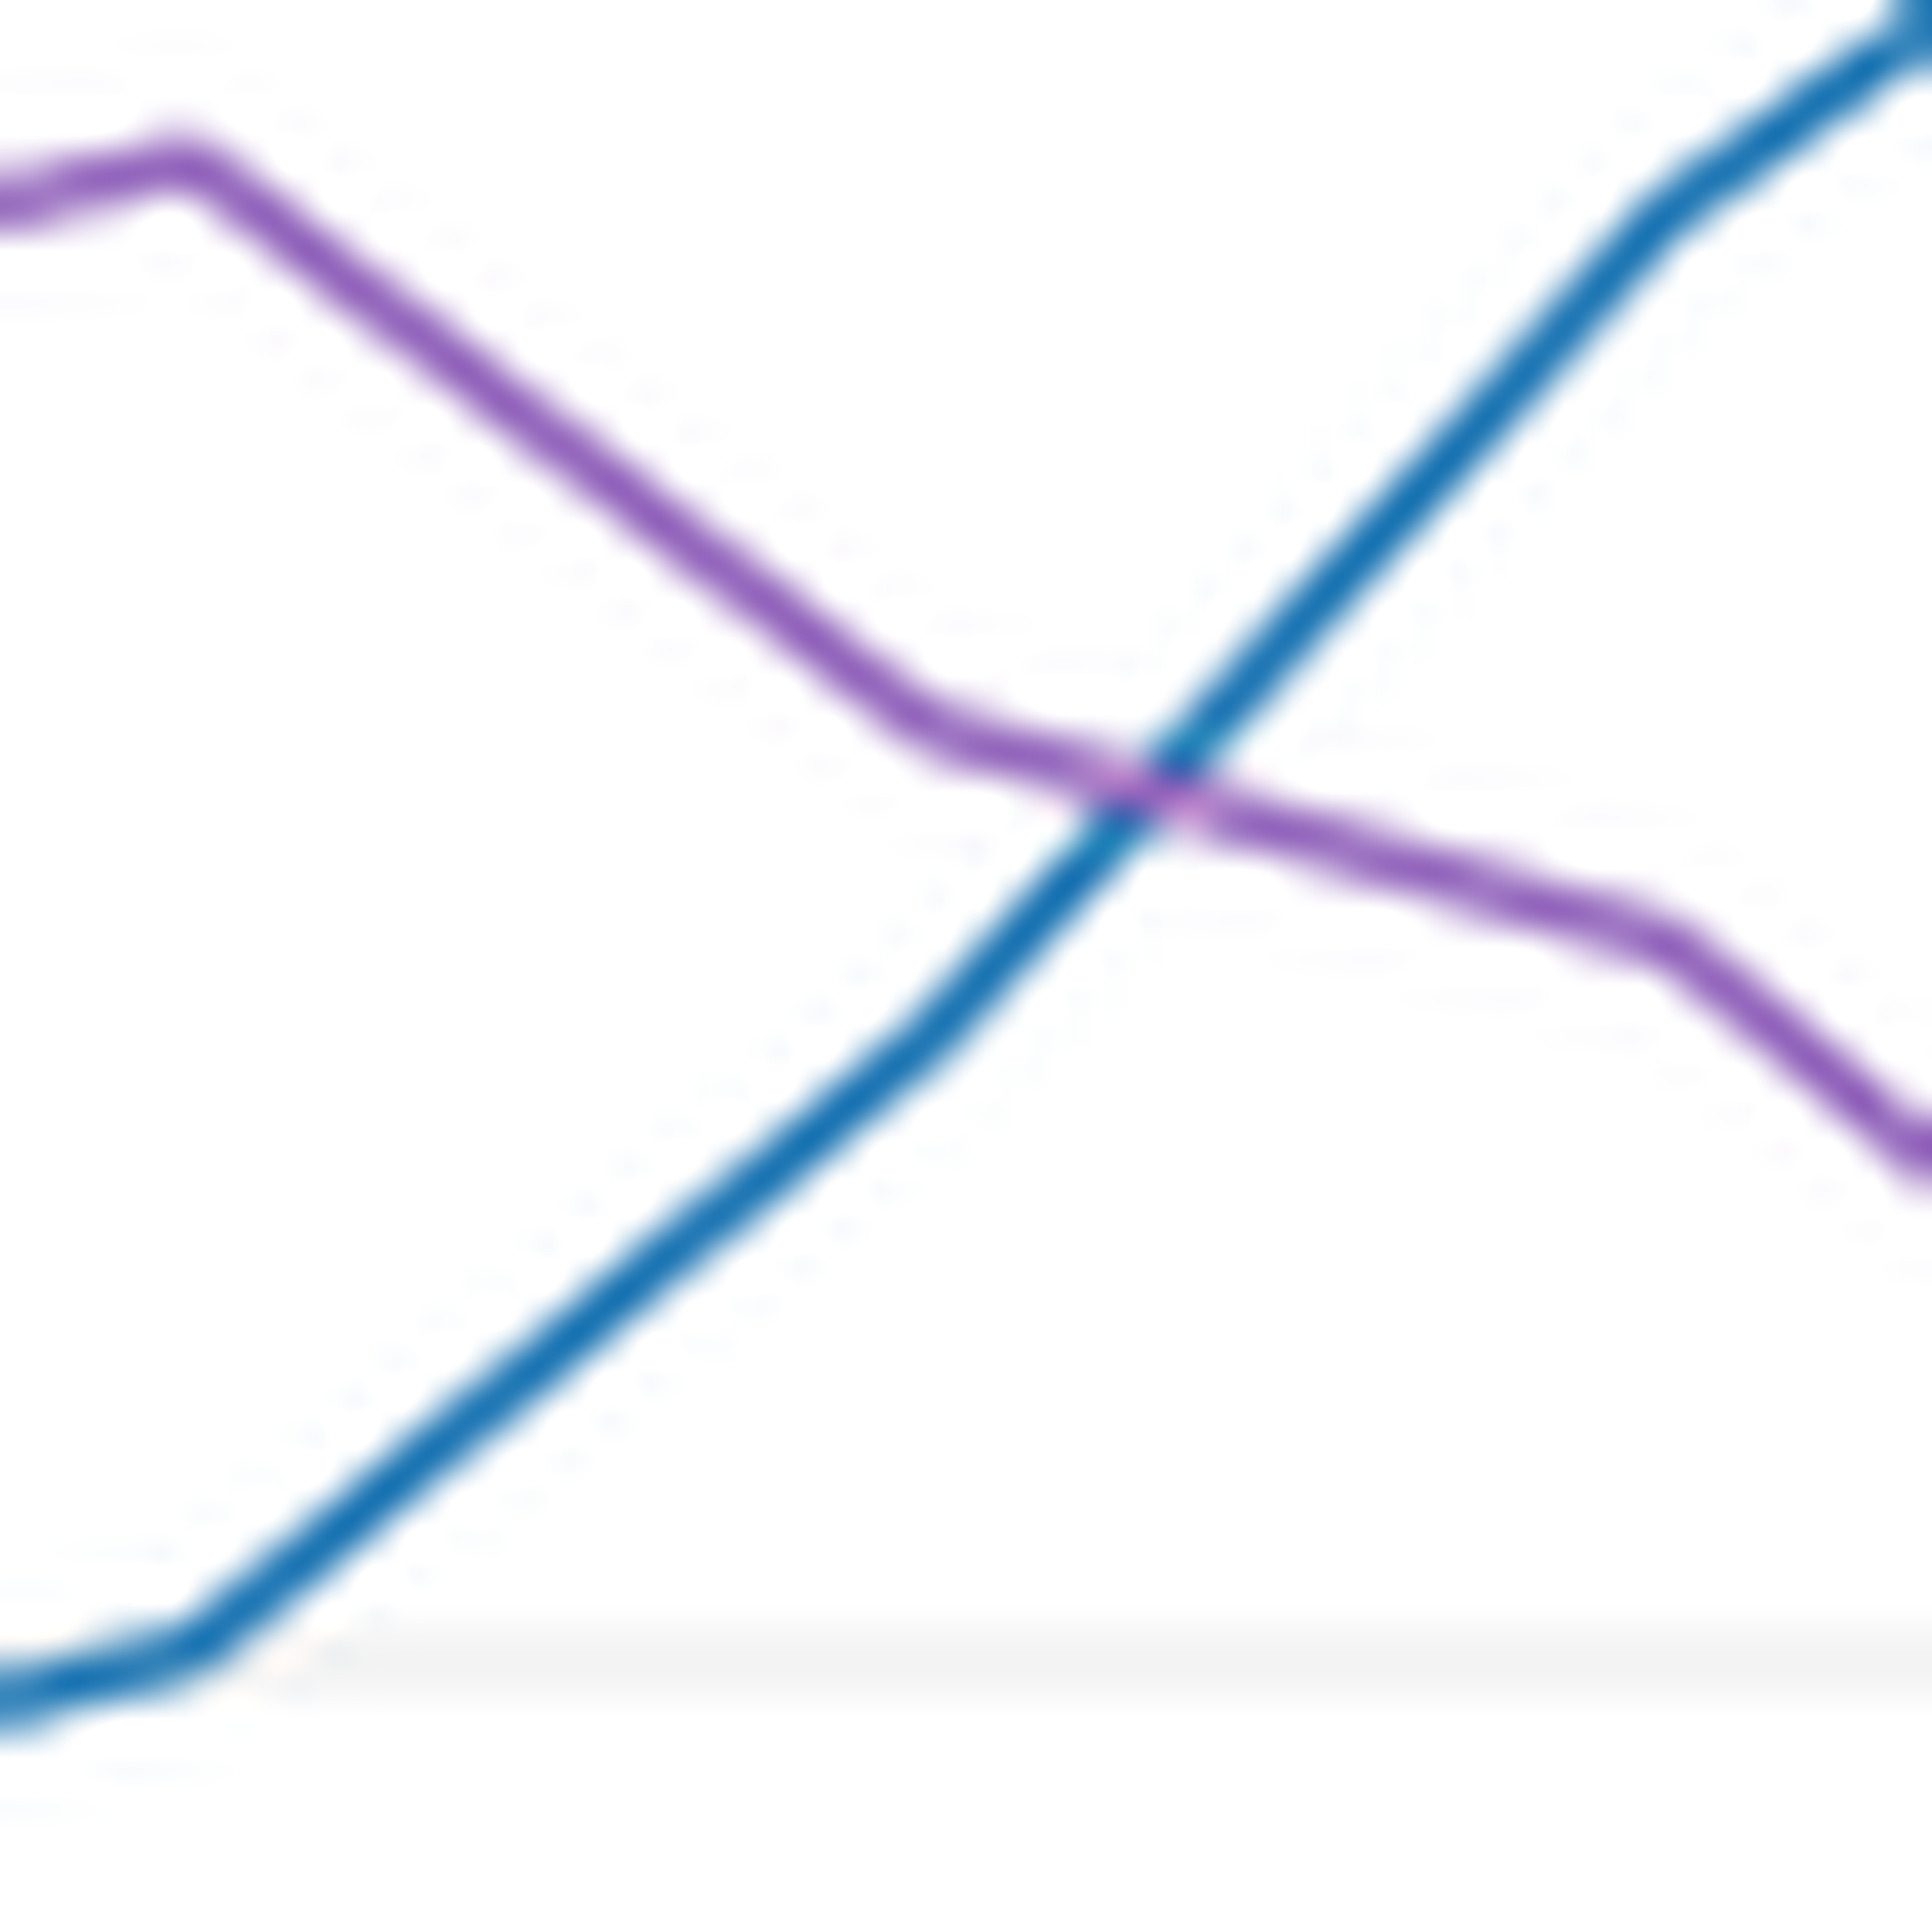
Zooming in on that region shows the purple Widget-E line (around ~5,310 units) sits just above the blue Widget-A line (around ~5,290 units) at month 48. The two lines cross shortly after — at roughly month 48–49 — after which Widget-A overtakes Widget-E, but at exactly month 48, Widget-E is still slightly higher.

Ground truth (from the data): Widget-E is higher at month 48, by about 26 units.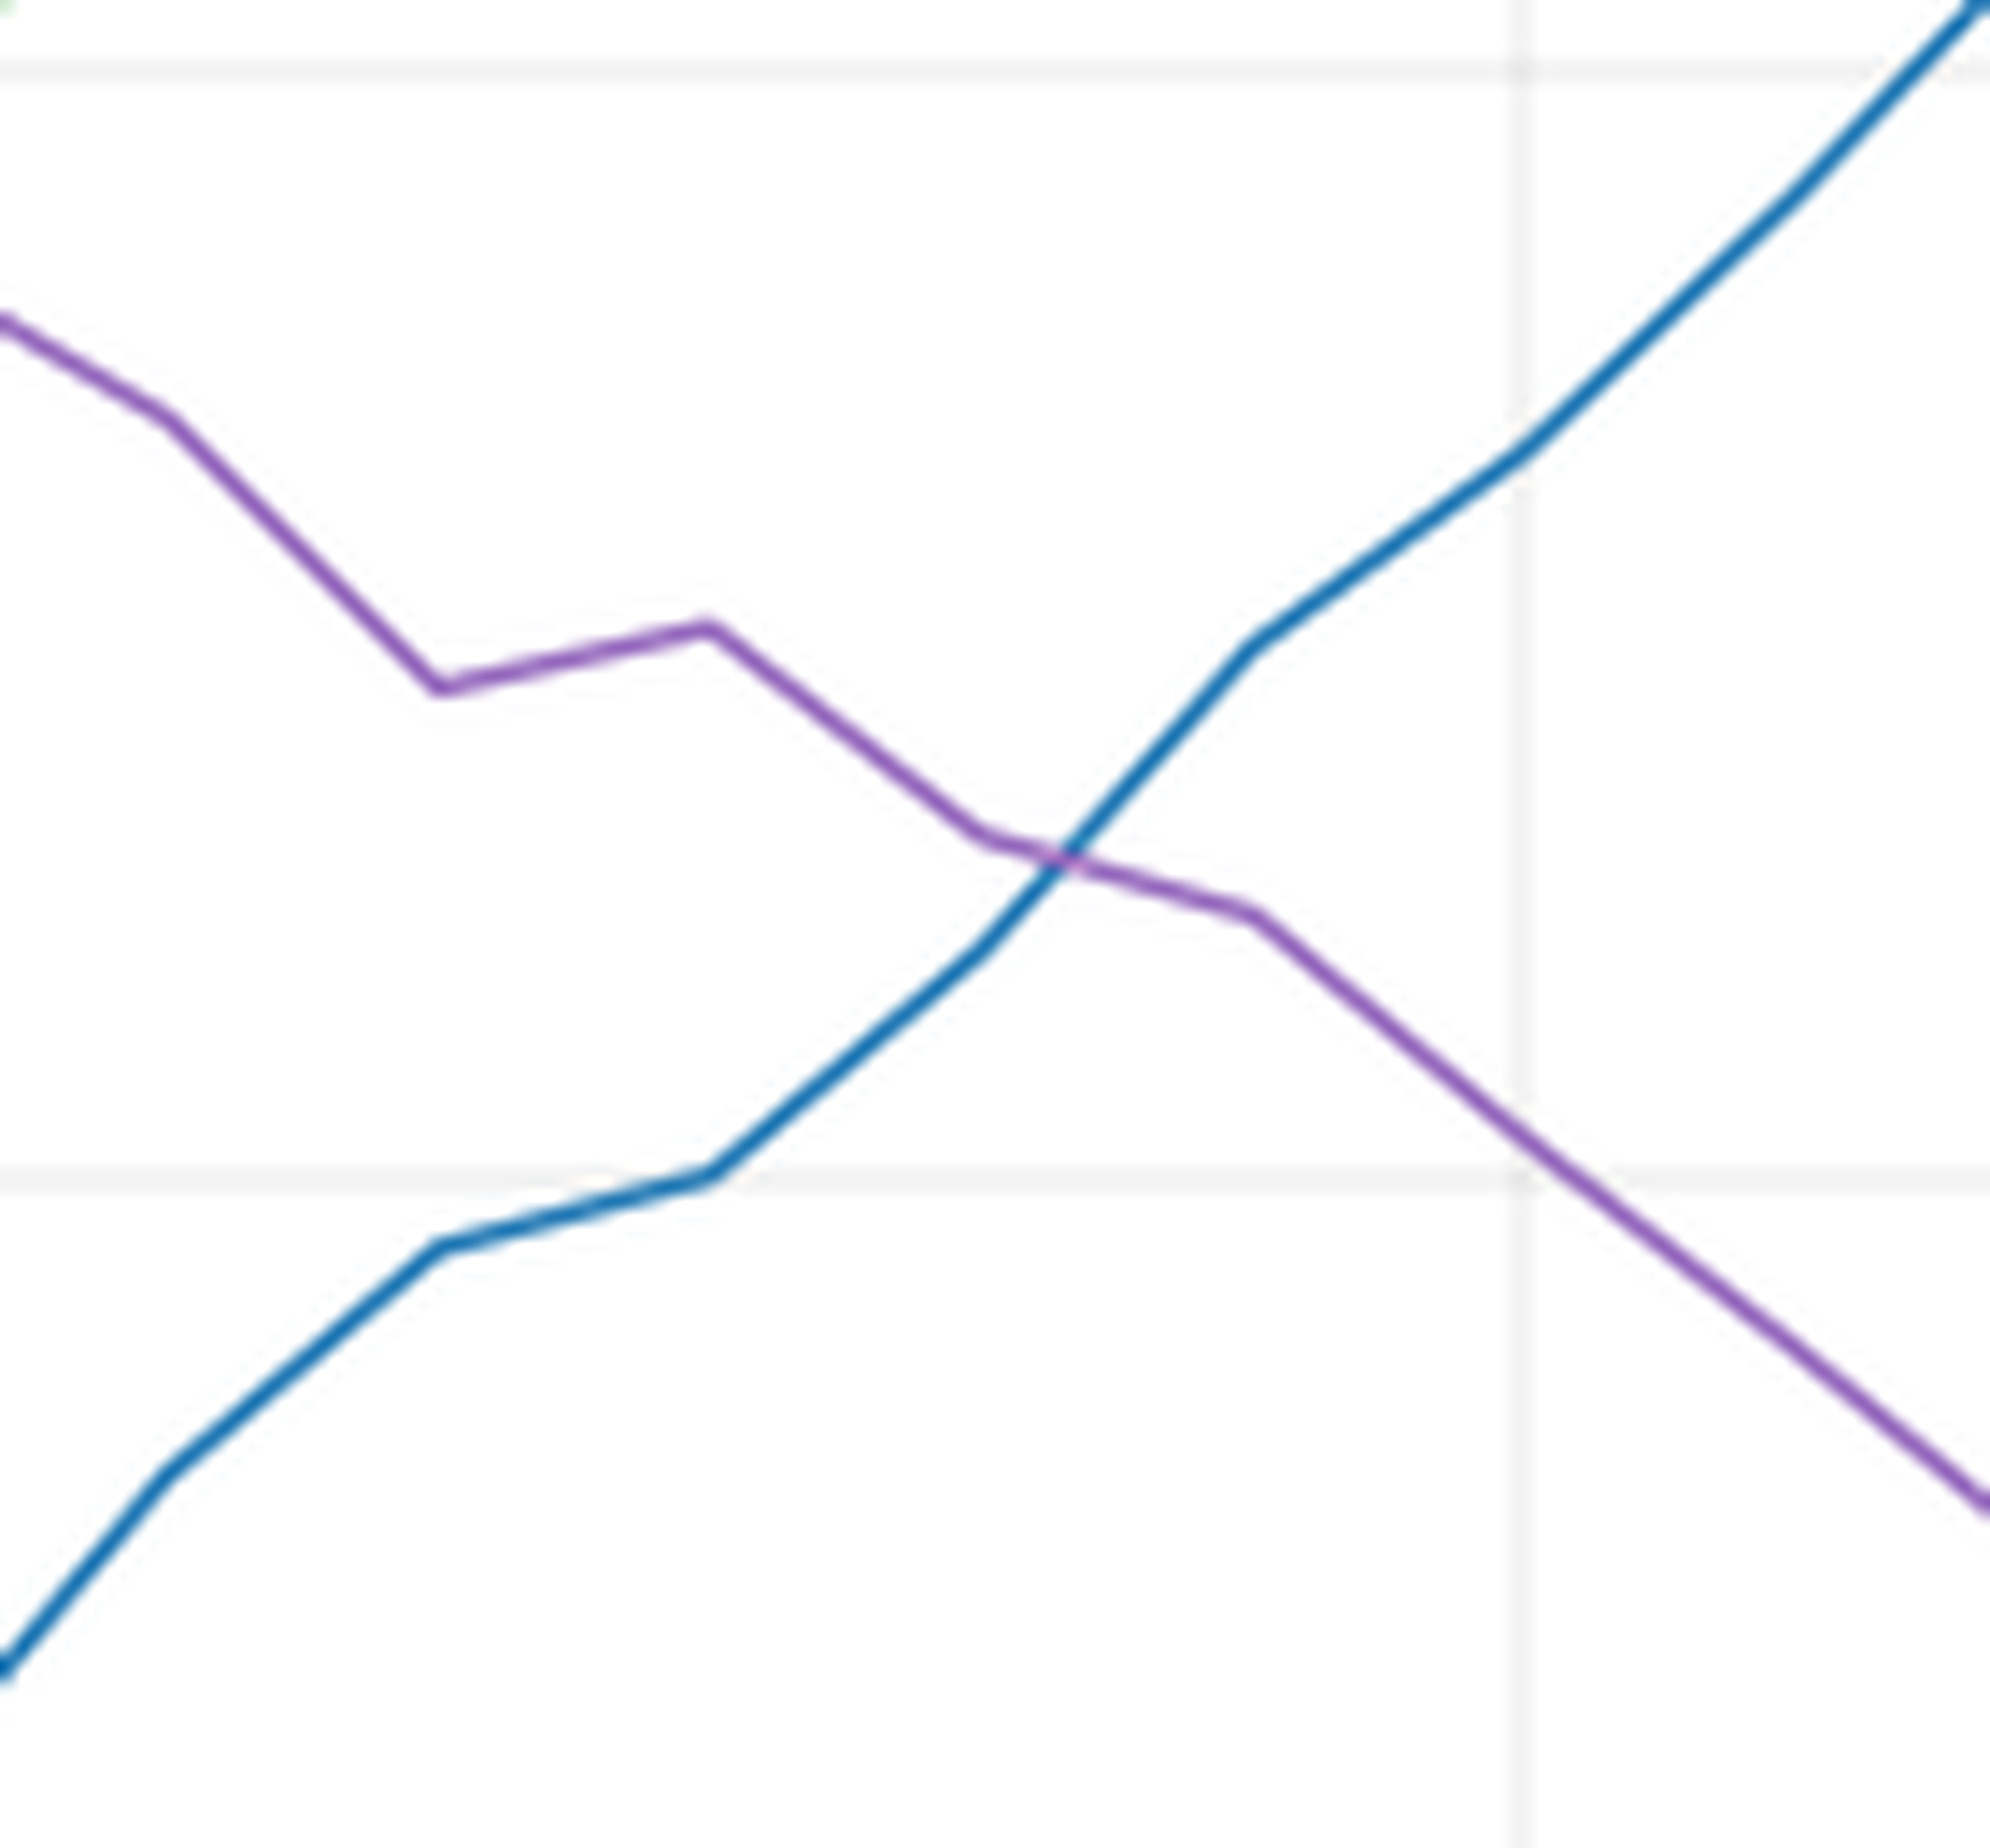
Here is that exchange in motion — the full view, the model's zoom call, and the magnified crop where the two lines finally separate:
Multi-Image Conversations
When a conversation contains several images, the tool needs to know which image to zoom into. The schema above already includes an optional image_index parameter (0 for the first image, 1 for the second, and so on), and ask_with_zoom_tool() accepts a list:
Each image is labeled with its index and pixel dimensions in the prompt, so Claude can name the image it wants and use the right coordinate space for it.
Summary
The zoom tool pattern:
- Pre-resize the image you send with
resized_size(), so Claude's pixel coordinates map 1:1 onto the image you have — and state the dimensions and the top-left origin in your prompt. - Define a zoom tool that takes absolute pixel coordinates.
- Crop from the full-resolution original, not from the downscaled copy, and scale the crop up to the model's image budget, so small elements get enough visual tokens to be read.
- Let Claude decide when and where to zoom.
This works because Claude can see the full image first, identify the regions that need closer inspection, and re-read them magnified. The trade-off: each zoom call adds a model round-trip and the zoomed image costs visual tokens, so expect better accuracy on detail-bound questions in exchange for higher latency and token usage. (And if you run Claude in an agent framework with code execution, you may not need to build any of this: an agent that can run code will typically write its own crop-and-magnify script on demand — the same pattern, self-served.)
Appendix: The Loop, By Hand
tool_runner is a convenience; everything it does can be written out with plain client.messages.create calls, and seeing the mechanics once is worth it — this is also where you control every edge case yourself: executing tool calls whenever they appear (even on a token-capped turn), resuming server-paused turns, giving the model one plain turn to answer when a token-capped turn produced neither a tool call nor any text, and dispatching tool names explicitly (unknown names get an error result back, so a model that hallucinates a tool can recover).
The version below is equivalent to the runner version in the common path, with two deliberate differences: the runner bounds iterations at 20 and pause-turn re-entries at 5, while this version runs until the model stops — add your own cap for production use.